(5/2/20) There are probably as many different opinions on models as there are models themselves. None can forecast with total accuracy and if one could you wouldn’t know it until it is too late. Still we need some forecasting tools to guide policy and responses.
As evident throughout this blog, we have been developing a model based primarily on the most reliable data available, deaths. From death rate and cumulative deaths and other measurable variables, we can compute number of cases (prevalence) and new cases (incidence) as well as forecast these values as well as deaths into the future. A useful outcome of these tools is the ability to forecast dates when it is safe to resume some level of work and social activity.
However, how do we know if a model is performing well? That usually means running it on historical data. Even though, like trying to predict the stock market, past performance is no guarantee of future results. We are here in the middle of an epidemic and so we can gain some indication based on the most recent historical performance. We can also compare ourselves to other models. However, all models are different and give different results. Still we have been benchmarking to what is emerging as the gold standard model and is now clearly the most widely followed model by the press and government agencies. This is the model by the University of Washington’s (UW) Institute for Health Metrics and Evaluation (IHME). The details of this model have not yet been published and are not well known. We believe we have many similarities such as depending strongly on death statistics.
The IHME and our model also make updates to forecasts based on new data. This would seem to be a sensible approach, but many “expert” modelers and epidemiologists consider this strategy a shortcoming because the forecasts can bounce around. Well I began my model for the very reason that these so-called experts were pontificating things that seemed far fetched and their models seemed to be too complicated with many variables that are hard to measure or define. So, these models may be good for ultimately understanding pandemics better (after the fact), but we are in the middle of a pandemic and need some real-time guidance and forecasts so I believe the strategy that I, and apparently IHME, are taking are valuable. There is a need for many models as they all make different assumptions or are trying to measure or forecast different properties.
So, to cut to the chase the plots below show the forecasted total final deaths for the various hotbed countries and U.S. states that my model is following alongside the IHME model forecasts over the same time period.
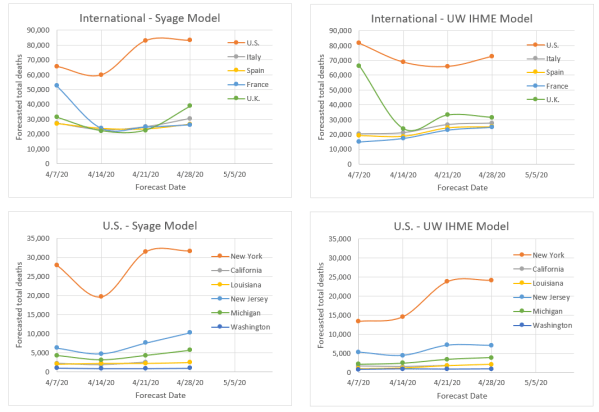
The following are key observations:
- The two models would appear to be more similar than dissimilar based on the relative qualitative agreement on death forecasts, e.g., the order of severity for different countries and states.
- Both models fluctuate, but not excessively relative to an epidemiological model that is calculating based on first principles.
- Both models seem to be on a slight rise in forecasting deaths. We think that is because both models a priori assume that the rise and fall behavior are symmetric, but evidence is now showing the decline is slower. We know how to modify our model to do this, but will not be able to do so before the pandemic mostly plays out. Instead we are applying an asymmetry factor to the downside to compensate. We do not know if IHME is doing anything similar.
- Our latest forecasts are all above those of IHME, but not greatly making us think that the difference is due to our including the asymmetry factor for the first time in the last update.
- Not shown in these plots but evident in the Weekly Update postings is that we tend to read the death rate data such that we believe countries and states are not as far past the peak as IHME indicates. We think this is due to our using a Gaussian function to monitor peaking, whereas they use an error function (integral of a Gaussian) to do so, which we believe is less sensitive to detecting changes, e.g., peaking. We both apparently use the error function to forecast total deaths but from different parts of the curve depending on how we read displacement from the peak.